Well, I hope you enjoyed that edition of "Writing Compilers with Gareth". I know I had fun.
But, here we are, on the third day of this project, having spent 12 hours coding (and blogging) and I haven't even so much as looked at the sample Chrome Extension yet, let alone built something that could look like it was a debugger, with side panels and source panes and the like. So I think it's time we did that.
Let's just take the plunge and use the "hello, world" tutorial as the basis to create an extension.
At this point, you may be asking yourself, are we just talking about Chrome here? What about Firefox, Safari or Edge? What about IE6 or Opera? Yes, we are just talking about Chrome here. I use Chrome and I'm not really interested in other browsers. If you want me to come and investigate how to do something like this for you for some other browser, you can pay me to do that if you want.
After the somewhat breathless previous episodes, I'm going to slow down a lot now, because this is what I'm investigating, and I really don't know what I'm doing.
Creating a Basic Extension
An extension needs a directory, so let's create that:$ mkdir plugin(Note that while Chrome calls these things extensions, I tend to think of them as plugins; my apologies if me conflating these terms is confusing.)
With every extension, it seems that you need to start with a manifest, called manifest.json. I'm not sure how much of what they show me is required, so let's start with nothing and build up from there until something loads:
{In my "Testing" version of Chrome (the same one I'm running the Till app in), I choose "Extensions > Manage Extensions" from the Kabob Menu, and then turn on the "Developer Mode" toggle. There is now an option to "Load Unpacked" extensions, so I click that, and then navigate to the cdp-till directory, click on plugin and then click Select.
}
It tells me I don't have manifest_version - which must be either 2 or 3. OK, let's go with 3.
{Apparently name is also required. It's cool that the loader offers "Retry" as an option, because that is going to save me a lot of time. Probably not as much as telling me all the things I'm missing in one go, but I can understand why.
"manifest_version": 3
}
{Version - a dotted version number - is also required. I went to Ubuntu-style date versions a long time ago, and that appears to be valid, even encouraged (four segments are allowed), so:
"manifest_version": 3,
"name": "Till Debugger"
}
{
"manifest_version": 3,
"name": "Till Debugger",
"version": "2025.03.19"
}
CDP_MINIMAL_EXTENSION:cdp-till/plugin/manifest.json
And that is acceptable. We have a Till Debugger Extension! Wow.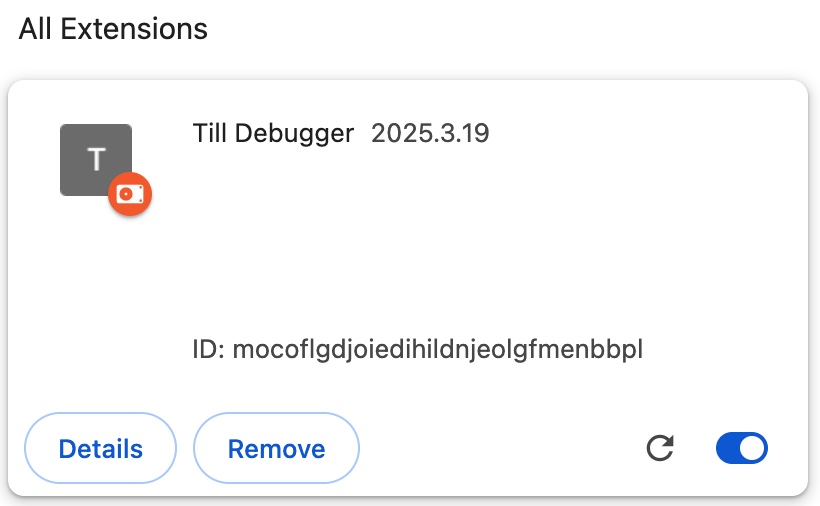
There is an option to "pin" this to the extension bar, so I'll do that. If it becomes unpinned (because I reinstall it or whatever), I will keep on pinning it back.
A SidePanel
I believe I want a "sidePanel" to open when I click on the extension. It's my understanding that this is the name that Chrome gives to the kind of sub-window that the developer tools open in. Looking through the documentation, this is described here, and I will now pick up on that.It says I need a sidePanel permission and it would seem that is declared in the manifest.json, so let's add that and refresh.
When I try refreshing, and even pressing Update, the Details pane on my extension continues to say it doesn't need any special permissions. Maybe this isn't a "special" permission? Well, I'm going to uninstall and reinstall and see what happens.
OK, it still doesn't say anything about permissions, so let's move on.
There is apparently a separate block in the manifest for configuring the side_panel, so let's do that. It requires you to specify a default html page, so I'll do that as well. Now when I reload it, I can click on the pinned icon, and there is an option to "open side panel". I click on that and ... the side panel opens. Excellent.
The manifest now looks like this:
{
"manifest_version": 3,
"name": "Till Debugger",
"version": "2025.03.19",
"permissions": ["sidePanel"],
"side_panel": {
"default_path": "sidepanel.html"
}
}
CDP_SIDEPANEL:cdp-till/plugin/manifest.json
and I have this in the sidepanel.html:<!DOCTYPE html>
<html>
<head>
<title>Till Debugger Panel</title>
</head>
<body>
<h1>Till Debugger</h1>
<p>This is the panel for displaying everything</p>
</body>
</html>
CDP_SIDEPANEL:cdp-till/plugin/sidepanel.html
I would like the panel to appear at the bottom, but that doesn't seem to be possible. It's possible that I need something that isn't a side panel, but if so, I'm not sure what. I'm going to press on for now.It seems to me that I would feel happier if my html file were buried a little, say under an html folder. Is that possible? Yes, that's possible, so I'll do that.
It would be good if the side panel opened when I clicked on the extension button. There's an example of how to do that in the tutorial, so let's do that now.
This appears to require the action key in the manifest. I've seen this quite a bit when looking at Chrome extensions, but I haven't quite figured out exactly what it means. It seems to have a lot of options. Maybe it is just "what does clicking the button do?"
{
"manifest_version": 3,
"name": "Till Debugger",
"version": "2025.03.19",
"permissions": ["sidePanel"],
"side_panel": {
"default_path": "html/sidepanel.html"
},
"action": {
"default_title": "Click to open debugger"
},
"background": {
"service_worker": "js/service-worker.js"
}
}
CDP_OPEN_PANEL_BUTTON:cdp-till/plugin/manifest.json
Separately, it specifies that we want to run a script in the background. This appears to be a key part of the infrastructure for Chrome Extensions. You can do things in this "worker" thread that you can't do elsewhere. It would seem if you specify this script in the manifest, then it is just "run" when your extension starts up. This gives us somewhere to add the code that says "open side panel on click":// Allows users to open the side panel by clicking on the action toolbar icon
chrome.sidePanel
.setPanelBehavior({ openPanelOnActionClick: true })
.catch((error) => console.error(error));
CDP_OPEN_PANEL_BUTTON:cdp-till/plugin/js/service-worker.js
And that just works. I click on my extension button and the side panel opens. Cool. I feel we're getting somewhere.Fetching Files from the Server
What I want to do first is to be able to show the source code in this side panel. How to do that? It feels like the first thing is to fetch the source code. So can I ask the server for the source code for cafe.till? It would seem that I can use the fetch operation to obtain the source code. Of course, I would need to provide a Go handler to offer the source code, so for now, I'll just fetch the JSON. We'll need that sooner or later anyway.chrome.sidePanel
.setPanelBehavior({ openPanelOnActionClick: true })
.catch((error) => console.error(error));
fetch("http://localhost:1399/till-code").then(resp => {
console.log(resp.status, resp.statusText);
});
CDP_PLUGIN_FETCH:cdp-till/plugin/js/service-worker.js
It seems that I need the permission webRequest.{
"manifest_version": 3,
"name": "Till Debugger",
"version": "2025.03.19",
"permissions": ["sidePanel", "webRequest"],
"side_panel": {
"default_path": "html/sidepanel.html"
},
"action": {
"default_title": "Click to open debugger"
},
"background": {
"service_worker": "js/service-worker.js"
}
}
CDP_PLUGIN_FETCH:cdp-till/plugin/manifest.json
It also seems that I need the server to conform to CORS:func (r *RepoHandler) ServeHTTP(resp http.ResponseWriter, req *http.Request) {
bs := r.repo.Json()
resp.Header().Set("Content-Type", r.mediatype)
resp.Header().Set("Content-Length", fmt.Sprintf("%d", len(bs)))
resp.Header().Set("Access-Control-Allow-Origin", "*")
resp.Write(bs)
}
CDP_PLUGIN_FETCH:cdp-till/internal/web/handlers.go
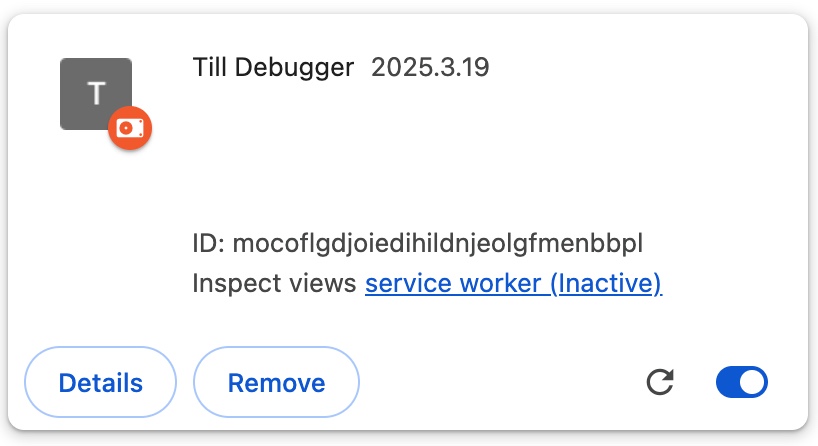
But when I've done that, it does work.I wasn't quite sure what would happen with console.log in this context and, indeed, it doesn't come out on "the" console. But in the extension box on the extensions page, there is now an opportunity to Inspect views that wasn't there before. Clicking on that allows me to see "my" console view. And I have a 200 OK, indicating that my fetch worked. Excellent.
No comments:
Post a Comment