This seems hard.
Once again, let's break it down and take it one step at a time. If we start by taking a deep breath, it won't seem so hard in a moment.
First, let's figure out even how to set a breakpoint; then we can figure out how to set a breakpoint on the appropriate method; then if we can figure out how to "continue" from a breakpoint without user interaction we can write "conditional" code that breaks if it is "the right time" and just continues otherwise.
One more thing: I don't know if we can do this from sidepanel.js or if we need to delegate to service-worker.js. Oh, well, let's get started.
Attaching to the Debugger using the CDP
OK, well, we've said all along that we will need to use the Chrome DevTools Protocol. So here we are.The obvious place to start is with Debugger.setBreakpoint. Unfortunately, this wants a Debugger.Location which we don't have. It would seem that at the very least, we need to handle Debugger.scriptParsed events in order to obtain the necessary Runtime.ScriptIds.
Remember to keep taking those deep breaths. We can do this.
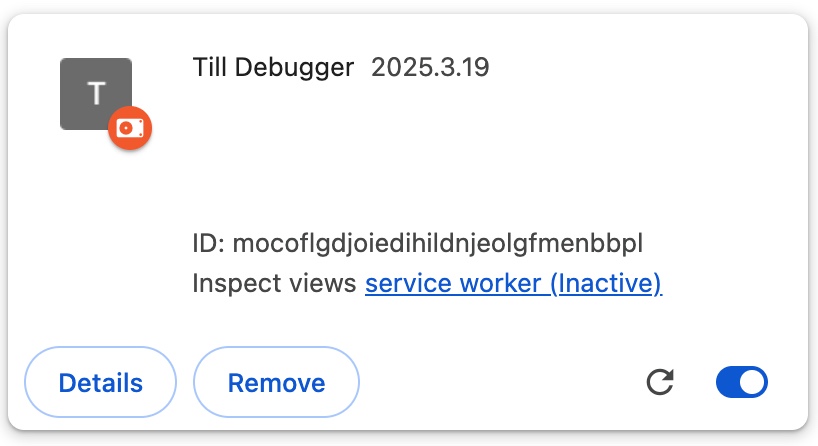
So, let's listen for those scriptParsed events, shall we? From reading the documentation, these events appear to be fired in the service-worker, so we'll put our code there.
chrome.debugger.onEvent.addListener(function(source, method, params) {
if (method == "Debugger.scriptParsed") {
console.log(params.url);
}
});
CDP_DEBUG_LISTEN:cdp-till/plugin/js/service-worker.js
By itself, this will not work. You cannot add listeners to debugger.onEvent without the debugger permission in your manifest. So let's add that:{
"manifest_version": 3,
"name": "Till Debugger",
"version": "2025.03.19",
"permissions": ["debugger", "sidePanel", "webRequest"],
"side_panel": {
"default_path": "html/sidepanel.html"
},
"action": {
"default_title": "Click to open debugger"
},
"background": {
"service_worker": "js/service-worker.js"
}
}
CDP_DEBUG_LISTEN:cdp-till/plugin/manifest.json
But if we update the extension, nothing happens. It turns out that by itself, even this is not enough. Much as with a "conventional" debugger, we need to "attach" to a target. What is a "target" in this scenario? Apparently, there are a lot of options, but we are just going to say a tab. How do we find a tabid? Well, we can query for tabs and match against their URL patterns. Easy.Let's start by finding all the tabs that are served by localhost. You can't explicitly match by port number, but I think we can do that when handling the response.
chrome.tabs.query({ url: "http://localhost/*" }).then(tabs => {
for (var tab of tabs) {
if (tab.url == "http://localhost:1399/") {
chrome.debugger.attach({ tabId: tab.id }, "1.3");
}
}
});
CDP_DEBUG_ATTACH:cdp-till/plugin/js/service-worker.js
The query method returns an array of all the tabs that match, so we can iterate through those and find "the one" that matches the port as well (if you want to be sure you get exactly one, you probably want to break out of this loop; other than that, you can distinguish them later by the "source" parameter that comes with all the events). We then call attach. This takes the tab.id along with a debugger protocol number. The documentation claims there is a list somewhere, but I couldn't find it. 1.3 seems to be mentioned several times, so I've gone with that until I find otherwise.When I did this, it still didn't work. But, of course, I'd forgotten about permissions. This needs to have the tabs permission specified in order to match by, and access, the url property of the tab.
{
"manifest_version": 3,
"name": "Till Debugger",
"version": "2025.03.19",
"permissions": ["debugger", "sidePanel", "tabs", "webRequest"],
"side_panel": {
"default_path": "html/sidepanel.html"
},
"action": {
"default_title": "Click to open debugger"
},
"background": {
"service_worker": "js/service-worker.js"
}
}
CDP_DEBUG_ATTACH:cdp-till/plugin/manifest.json
It still doesn't work? How can that be? Well, it turns out that attaching the debugger is not enough; you also then need to enable the debugger. How do you do this?It took me quite a while going through people waffling about the debugger domain before I finally grasped that this was something you needed to do with sendCommand:
chrome.tabs.query({ url: "http://localhost/*" }).then(tabs => {
for (var tab of tabs) {
if (tab.url == "http://localhost:1399/") {
chrome.debugger.attach({ tabId: tab.id }, "1.3");
chrome.debugger.sendCommand({ tabId: tab.id }, "Debugger.enable");
}
}
});
CDP_DEBUG_ENABLE:cdp-till/plugin/js/service-worker.js
And now, finally, when I update the extension I see a string of messages coming out about the files that it is successfully loading:http://localhost:1399/js/till-runtime.jsFor debugging purposes, I have just written out the url of the script when I see the scriptParsed event, but it does actually have a lot more information in there and we'll hopefully be using that in a bit in order to set our breakpoints.
http://localhost:1399/js/repository.js
http://localhost:1399/js/state.js
http://localhost:1399/js/layoutengine.js
http://localhost:1399/js/method.js
http://localhost:1399/js/layout.js
http://localhost:1399/js/assign.js
http://localhost:1399/js/clear.js
http://localhost:1399/js/enable.js
http://localhost:1399/js/submit.js
Finally Setting a Breakpoint
What I want to do is to set a breakpoint on Method.execute and, while there is an experimental command setBreakpointOnFunctionCall, I'm not sure I can get into the position to call it, even if it works and does what I think it should.So, instead, I'm going to reverse engineer the location of Method.execute and set a breakpoint on its first line.
Now, I could just look at the source and say "OK, method.js, line 45" and be done with it. But that would not be very resilient. So I'm not going to do that. I have a callback providing me the scriptId and with that I can obtain ther original JavaScript code by using the Debugger.getScriptSource command. I have already written the code to split that into lines, so I can copy that, and then I can scan through until I find the execute( line. That's where I'll want to set my breakpoint.
I don't see any booby traps here, so let's just write that in code:
chrome.debugger.onEvent.addListener(function(source, method, params) {
if (method == "Debugger.scriptParsed") {
if (params.url.endsWith("method.js")) {
chrome.debugger.sendCommand(source, "Debugger.getScriptSource", { scriptId: params.scriptId }).then(src => {
var lines = src.scriptSource.split(/\r?\n/g);
for (var i=0;i<lines.length;i++) {
if (lines[i].match(/^\s*execute\(/)) {
console.log(i+1, lines[i]);
console.log("thus break at", i+2);
}
}
});
}
}
});
CDP_DEBUG_FIND_LINE:cdp-till/plugin/js/service-worker.js
And it duly shows me:44 '\texecute(state) {'Very good. I was starting to doubt my ability to write correct code first time for a while there.
thus break at 45
Now we can turn around and actually set that breakpoint:
chrome.debugger.onEvent.addListener(function(source, method, params) {
if (method == "Debugger.scriptParsed") {
if (params.url.endsWith("method.js")) {
chrome.debugger.sendCommand(source, "Debugger.getScriptSource", { scriptId: params.scriptId }).then(src => {
var lines = src.scriptSource.split(/\r?\n/g);
for (var i=0;i<lines.length;i++) {
if (lines[i].match(/^\s*execute\(/)) {
console.log(i+1, lines[i]);
console.log("thus break at", i+2);
chrome.debugger.sendCommand(source, "Debugger.setBreakpoint", { location: { scriptId: params.scriptId, lineNumber: i+1, columnNumber: 0 }}).then(brk => {
console.log("breakpoint at", brk);
});
}
}
});
}
}
});
CDP_SET_BREAKPOINT:cdp-till/plugin/js/service-worker.js
Note that this just uses a lineNumber of i+1 rather than i+2. This is because the API for setting breakpoints is also zero based. So the +1 that we've kept is moving on from the execute line to the for line.And it all seems to work fine:
breakpoint at {It's interesting to me that it reports the actual location as being at column number 21. I'm sure that's right, but it's not what I would expect. I believe that's just at the beginning of actions.
actualLocation: {columnNumber: 21, lineNumber: 44, scriptId: '5300'}
breakpointId: "4:44:0:5300"
}
What Happens Now?
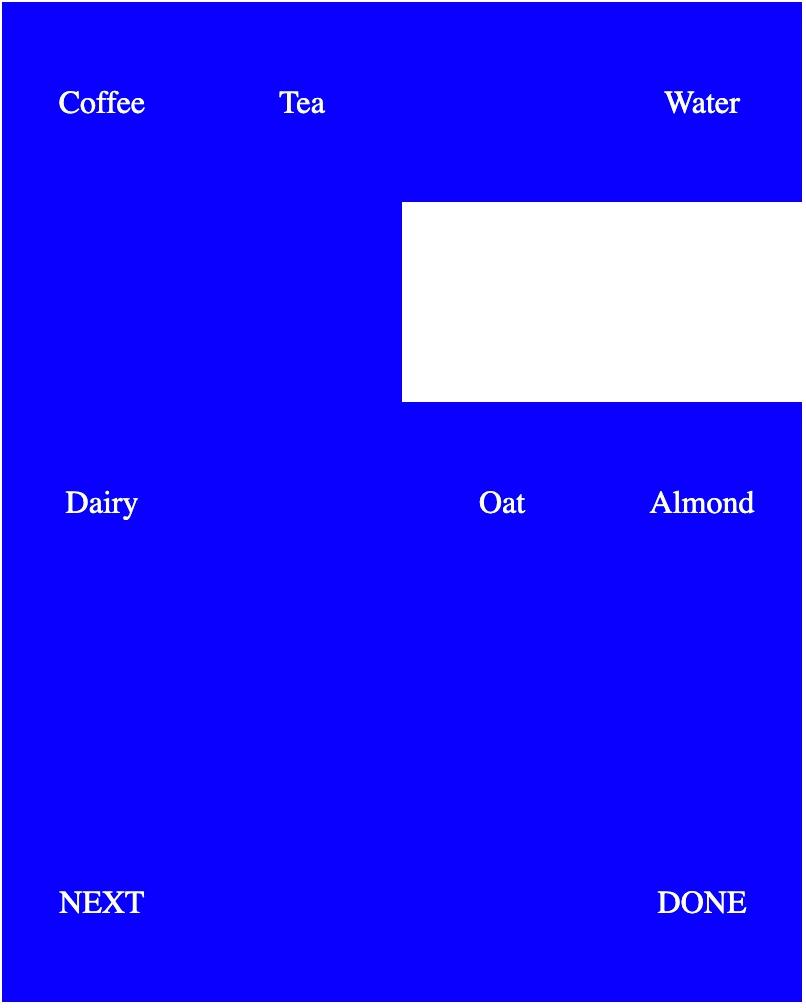
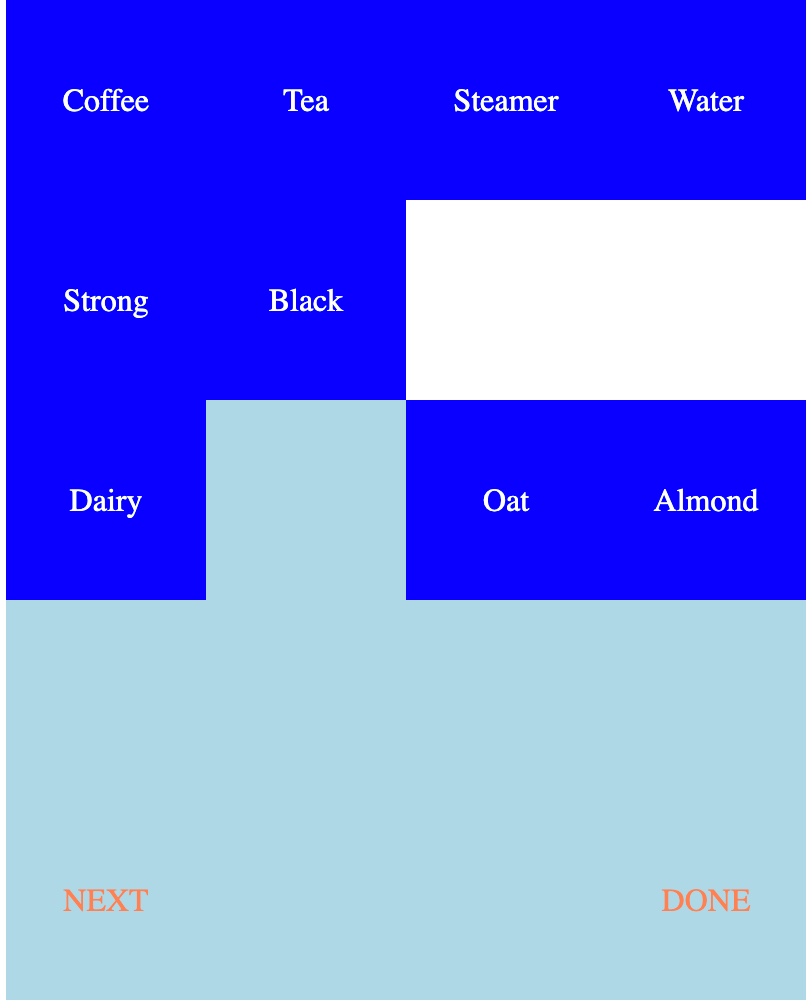
So we've set a breakpoint, and I would expect that it would "do something" when I hit that breakpoint. Looking at the builtin debugger, it does not show that it sees a breakpoint there, so I don't think that debugger is going to be activated. Let's try it.OK, my intuition is wrong. The moment that I click on Tea, the builtin debugger activates and shows me the relevant line. There isn't a breakpoint marker, but the token actions is highlighted - just where the actualLocation said it was. OK. But I know how to disable the builtin debugger - I just close the tray.
But nevertheless, my TILL program does not work any more. It is clearly halting when it hits the breakpoint. I can use the builtin debugger to continue it, but with that open or closed, it hits the breakpoint. I suppose this is what I should have expected. It has probably sent me an event to say "your breakpoint has been hit" and then suspended the program until I tell it what to do. Back to the documentation!
In the "debugger domain", there is a Debugger.paused method which is "fired when the virtual machine stopped on breakpoint or exception or any other stop criteria." That seems fairly comprehensive. So I should be getting one of those, right?
Yes, I do. Looking at the info that I am given, it seems that reason is other, which seems weak, but there is also a hitBreakpoints array and that contains the same string id that I was given when I set my breakpoint. Excellent. The callFrames also looks interesting, but when I dig into that, I'm not really sure what I'm seeing, although reading the documentation suggests that I can obtain the current scopes and thus access the local (and global) variables. Good. We'll need that in a bit.
For now, can we just pretend we didn't go to all that effort to set a breakpoint, and just continue? It looks like the Debugger.resume command is what we're looking for, so let's do that.
chrome.debugger.onEvent.addListener(function(source, method, params) {
if (method == "Debugger.scriptParsed") {
if (params.url.endsWith("method.js")) {
chrome.debugger.sendCommand(source, "Debugger.getScriptSource", { scriptId: params.scriptId }).then(src => {
var lines = src.scriptSource.split(/\r?\n/g);
for (var i=0;i<lines.length;i++) {
if (lines[i].match(/^\s*execute\(/)) {
chrome.debugger.sendCommand(source, "Debugger.setBreakpoint", { location: { scriptId: params.scriptId, lineNumber: i+1, columnNumber: 0 }}).then(brk => {
console.log("breakpoint at", brk);
});
}
}
});
}
} else if (method == "Debugger.paused") {
console.log("paused: ", params.reason, params.hitBreakpoints, params.callFrames);
chrome.debugger.sendCommand(source, "Debugger.resume").then(resp => {
console.log("resume response", resp);
});
}
});
CDP_HANDLE_BREAKPOINTS:cdp-till/plugin/js/service-worker.js
And, yes, that all works very nicely, thank you!breakpoint at {actualLocation: {…}, breakpointId: '4:44:0:5569'}It's always worth checking that something happens when resolving a promise, but certainly the resume response is not interesting.
paused: other ['4:44:0:5569'] (2) [{…}, {…}]
resume response {}
paused: other ['4:44:0:5569'] (2) [{…}, {…}]
resume response {}
paused: other ['4:44:0:5569'] (2) [{…}, {…}]
resume response {}
paused: other ['4:44:0:5569'] (2) [{…}, {…}]
resume response {}
Matching Against Our Breakpoints
So now we have successfully worked through all the issues with the actual debugger and managed to set a breakpoint in Method.execute(). But all we are doing is continuing when we hit it. What we need to do is to see whether or not we are interested in this breakpoint and - if we are - highlighting the line in the sidepanel to show where we are.Again, that's easily said, but it's a string of operations and I think we will be best served taking them one at a time.
So, for now, let's just see if we can recover enough state from the information we receive from the paused event that we can display the original line number in our source code of the exact method being executed at the moment (note that because we are only setting a breakpoint in method.js, this will only show line numbers that are on lines that say init or button - not on the individual actions).
It's not entirely obvious what to do with all of the information we've been given, but I came across the Debugger.evaluateOnCallFrame command, and that looks interesting. Can I just write my expression - this.lineNo - as a string and send it there? The callFrameId is easily found from the params.callFrames array I've been given.
Well, that was easy:
chrome.debugger.onEvent.addListener(function(source, method, params) {
if (method == "Debugger.scriptParsed") {
if (params.url.endsWith("method.js")) {
chrome.debugger.sendCommand(source, "Debugger.getScriptSource", { scriptId: params.scriptId }).then(src => {
var lines = src.scriptSource.split(/\r?\n/g);
for (var i=0;i<lines.length;i++) {
if (lines[i].match(/^\s*execute\(/)) {
chrome.debugger.sendCommand(source, "Debugger.setBreakpoint", { location: { scriptId: params.scriptId, lineNumber: i+1, columnNumber: 0 }}).then(brk => {
console.log("breakpoint at", brk);
});
}
}
});
}
} else if (method == "Debugger.paused") {
console.log("paused: ", params.reason, params.hitBreakpoints, params.callFrames);
chrome.debugger.sendCommand(source, "Debugger.evaluateOnCallFrame", { callFrameId: params.callFrames[0].callFrameId, expression: "this.lineNo" }).then(resp => {
console.log("line #:", resp.result.value);
chrome.debugger.sendCommand(source, "Debugger.resume").then(resp => {
console.log("resume response", resp);
});
});
}
});
CDP_RECOVER_LINENO:cdp-till/plugin/js/service-worker.js
So now it's just a question of figuring out if that's one of "our" breakpoints or not. Sadly, that information is in the sidepanel, not in the service worker.Communicating breakpoints from the sidepanel
In order to resolve that, we need to move information from one area to the other. For now, I think it's easiest to send across the breakpoint information from the sidepanel to the service worker every time it is set (or cleared) and to keep the current list of breakpoints in the service worker. There is some duplication here - the breakpoints are also maintained in the state of the <td> elements in the sidepanel - but that's just life.There are a number of ways of communicating this information. One would be to put it in "local extension storage" and that has the advantage that it would be persistent, but I'm going to do the more obvious thing of communicating it using message passing.
We obviously need a map on the server side to keep track of our breakpoints:
var breakpointLines = {};This is one of these things where it's always hard to know whether to build the listener or the sender first. Since we're in the service worker, let's add the listener:
chrome.runtime.onMessage.addListener(function(request, sender, respondTo) {
switch (request.action) {
case "breakpoint": {
if (request.enabled) {
breakpointLines[request.line] = {};
} else {
delete breakpointLines[request.line];
}
break;
}
default: {
console.log("message:", request);
break;
}
}
});
CDP_BREAKPOINTS_TO_SERVICE_WORKER:cdp-till/plugin/js/service-worker.js
It's only really possible to explain this when you've seen the sender:tbody.addEventListener('click', ev => {
var target = ev.target;
var row = target.parentElement;
if (row.tagName == 'TR') {
var lineNoTD = row.querySelector(".line-no"); // this is a td
var lineText = lineNoTD.innerText;
var lineNo = Number(lineText);
if (breakLines[lineNo]) {
var enabled = lineNoTD.classList.toggle("breakpoint");
chrome.runtime.sendMessage({ action: "breakpoint", line: lineNo, enabled: enabled }).then(resp => {
console.log("response", resp);
});
}
}
});
CDP_BREAKPOINTS_TO_SERVICE_WORKER:cdp-till/plugin/html/js/sidepanel.js
The sender sends a simple object through the channel which has an action (currently always "breakpoint"), a line where the breakpoint is set, and enabled to indicate if it is being set or cleared. The listener looks at the action, and has exactly one case (for "breakpoint") and if tests if the breakpoint is to be enabled or not and then makes the appropriate update to the map.Testing if the Breakpoint has been Set
So we want to test if we've hit the right breakpoint or not. This is basically just a question of putting the last two things together and testing if we have an entry in breakpointLines for the method lineNo.} else if (method == "Debugger.paused") {
console.log("paused: ", params.reason, params.hitBreakpoints, params.callFrames);
chrome.debugger.sendCommand(source, "Debugger.evaluateOnCallFrame", { callFrameId: params.callFrames[0].callFrameId, expression: "this.lineNo" }).then(resp => {
var lineNo = resp.result.value;
console.log("line #:", lineNo);
if (breakpointLines[lineNo]) {
console.log("actual breakpoint");
} else {
chrome.debugger.sendCommand(source, "Debugger.resume").then(resp => {
console.log("resume response", resp);
});
}
});
}
CDP_MATCHED_BREAKPOINT:cdp-till/plugin/js/service-worker.js
If we do, we have to stop and go into "debug mode", otherwise we carry on. What is debug mode? Well, quite a lot of hard work, so for now we just log a message.Marking the source
The first thing we want to do in "debug mode" is to mark the source line that we have hit as the current line to debug. Let's make the background a pleasant lime green.This requires the reverse of what we did above to let the service worker know about the setting of the breakpoint: the service worker now needs to alert the sidepanel that the breakpoint has been hit.
The roles may be reversed, but the mechanism is much the same. Here's the sender first this time:
} else if (method == "Debugger.paused") {
console.log("paused: ", params.reason, params.hitBreakpoints, params.callFrames);
chrome.debugger.sendCommand(source, "Debugger.evaluateOnCallFrame", { callFrameId: params.callFrames[0].callFrameId, expression: "this.lineNo" }).then(resp => {
var lineNo = resp.result.value;
console.log("line #:", lineNo);
if (breakpointLines[lineNo]) {
chrome.runtime.sendMessage({ action: "hitBreakpoint", line: lineNo });
} else {
chrome.debugger.sendCommand(source, "Debugger.resume").then(resp => {
console.log("resume response", resp);
});
}
});
}
CDP_MARK_BREAKPOINT:cdp-till/plugin/js/service-worker.js
In the sidepanel, we listen for this event and then update the currently marked line (clearing the old one if needed). I quietly updated the code that parses the source file to track the trs as we create them and stored that in sourceLines.chrome.runtime.onMessage.addListener(function(request, sender, respondTo) {
switch (request.action) {
case "hitBreakpoint": {
var l = request.line;
if (breakAt) {
breakAt.classList.remove("current-break");
}
breakAt = sourceLines[l].children[1];
breakAt.classList.add("current-break");
break;
}
default: {
console.log("message:", request);
break;
}
}
});
CDP_MARK_BREAKPOINT:cdp-till/plugin/html/js/sidepanel.js
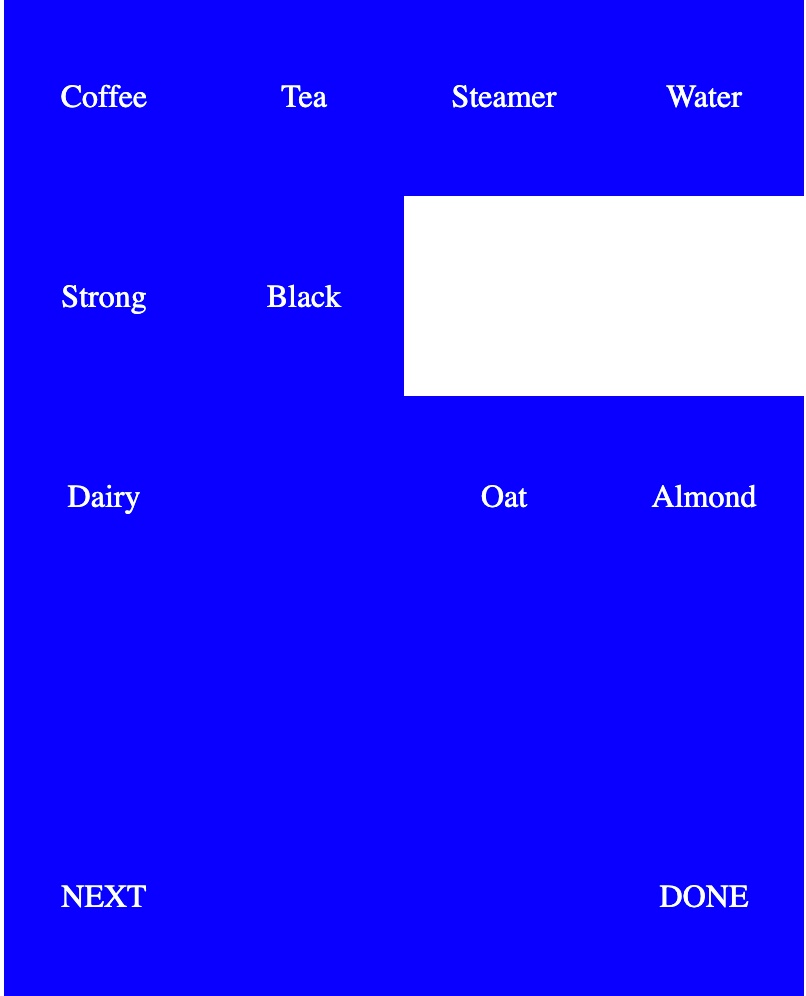
And the line gets marked as we break. We can't do anything here yet - even continue - but that's for another time.Conclusions
In this episode, we've broken the back of all the things we need to do. We've used the debugger API, examined source files, set breakpoints, handled breakpoints being hit, continued and figured out how to evaluate expressions in the current context.It may not seem the same to you, but to me it feels as if I have answered almost all of the "can I?/can't I?" questions here. Everything that follows may be things that I haven't done before, but it feels like I am onto simple coding, not investigation and experimentation. Expect the pace to pick up again.
We will have to come back to one remaining difficult question, which is whether or not we can look at the DOM in the target, which would seem to require the use of "content scripts" which I have read about but not used yet.